Posted by: Atlantic Eye Institute in Education,Eye Exams

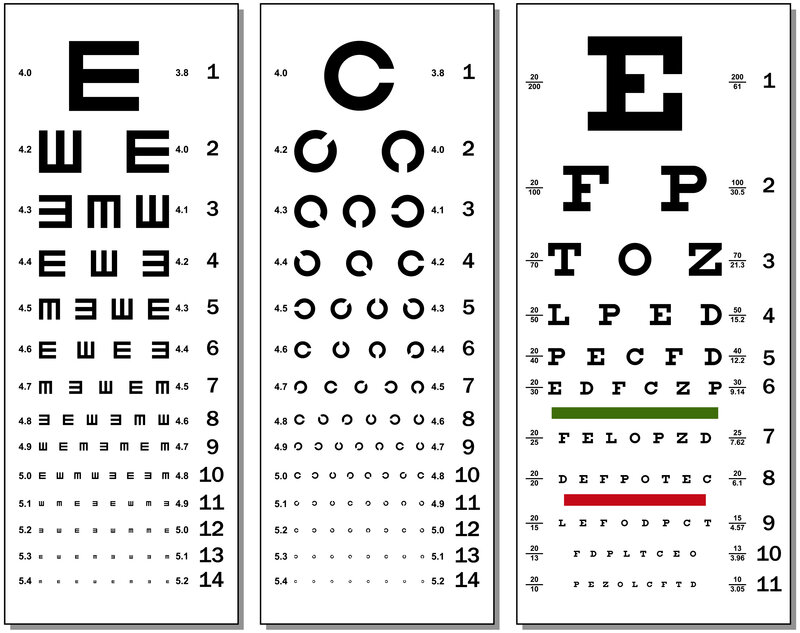
Every day, millions of American adults and children sit in an optometrist’s chair and recite what they see on a black-and-white “eye chart.” The chart is called the Snellen Chart, named after its creator, Herman Snellen.
It is an example of the fact that sometimes the most simple tools are the best, and while we do have higher-tech optometry and ophthalmology tools at our disposal, the Snellen Chart continues to be an eye exam staple.
Meet The Snellen Eye Chart (1862 – Present)
The Snellen Eye Chart was created by an opthalmologist named Herman Snellen in 1862. Dr. Snellen lived, studied, and practiced medicine in Utrecht, Netherlands. One of his colleagues, Dr. Franciscus Donders, used a chart in his office to help diagnose his patients’ vision and determine their best lens prescription.
The result was a chart with letters organized proportionally and in rows organized with font sizes ranging from larger to smaller as the patient made their way down the chart. As the NIH Library points out, “the sizing of letters is geometrically consistent, meaning that optotypes representing 20/40 are twice the size of those representing 20/20.”
The standard eye chart consists of nine different letters:
- C
- D
- E
- F
- L
- O
- P
- T
- Z
Snellen selected these roman letters as they were part of the Duch language symbology. However, Snellen Charts have been translated into dozens of different “languages” so the letters/characters match the patient’s native language.
While other eye exam charts were used by optometrists and ophthalmologists around the western world, none of them were considered a “standard.” A standardized chart was revolutionary because it allowed people to have their visual acuity tested in any office that had the chart with the same results and prescription. By the late 1800s, travel options were more available to the middle classes. And, as a result of industrialization, workers who may not have needed glasses at home for general tasks found they did need clear vision to perform jobs that required finer handwork or machine skills.
With the standardization of the Snellen Eye Chart, workers and travelers could visit any eyecare provider or eyeglass maker who had a Snellen Chart and receive the same consistent results.
What About Patients Who Couldn’t Read?
These days, the majority of the adult population is literate. However, that was not the case at all during the 1800s. Plus, children and those with certain disabilities aren’t able to read the different letters on the chart. Dr. Snellen accounted for illiteracy by creating a “The Tumbling E” chart. That version of the Snellen Chart maintained the same level of geometric consistency but only had a series of letter “E”s positioned in different directions.
This chart worked perfectly because the letter E could be replicated by a person holding three fingers (index, middle, and ring finger). So, as they looked at the charts, first with one eye covered – then the other eye covered – and then with both eyes open – patients used their three fingers to demonstrate the orientation of the letter “E.”
Today, we do things differently for those who can’t read. We have Snellen-like charts that use symbols rather than letters. Historically, symbols were intentionally selected to represent common everyday objects, like a house, tree, flower, umbrella, bird, etc. This made it easier for patients to identify what’s what. Today, we use a standardized version called the LEA Symbols Chart, which uses a square, house, apple, and circle.
Also, technological advances in optometric equipment allow us to look into a patient’s eyes using machines that can tell how well the eye is focusing or not. For example, an autorefractor measures a patient’s refractive error and prescribes lenses. We use this to examine most of our patients before bringing them in to read the Snellen Chart. However, we still prefer to get a reading on our own based on the Snellen Chart reading, combined with the phoropter that allows us to try out different lens combinations until we’re 100% sure about your lens prescription.
Snellen’s Isn’t the Only Visual Acuity Chart
Fun Fact: According to Roche.com, the Snellen Eye Chart is the most famous poster in history. It has been translated into other languages and characters, using the same geometrically consistent and gradually scaled-down sizes as the original.
While the Snellen Chart’s basic premise continues to be the optometric and ophthalmologic standard, other notable visual acuity charts are also used. These include:
Bailey-Lovie Eye Chart
This is a revamp of the Snellen Chart and is the one most widely used in doctor and optometrist offices today.
ETDRS
This is a redesign of the Bailey-Lovie Chart, designed to accommodate shorter distances (13 feet) available in most doctor’s offices.
LEA Symbols Chart
This is the eye chart we mentioned above, used for children or those who can’t read.
Jäger
Different from the Snellen Chart, Dr. Jäger created a series of printed cards used to test the patient’s near vision.
Landoldt C
The Landoldt C chart uses the same idea as the tumbling E, but the patient’s cupped hand (to recreate a C) rotates to mimic the Tumbling C orientation. It is regarded as a laboratory standard by the International Council of Ophthalmology.
Freiburg Visual Acuity Test (FrACT)
This is a computer-generated version of the Landoldt C chart that displays a large version on a computer monitor or screen.
When Was The Last Time You Read An Eye Chart At The Optometrist?
Have you read a Snellen Eye Chart in an optometrist’s office in the past year? If not, the odds are you need to schedule an appointment for a routine eye exam at Atlantic Eye Institute. If you’re an eye chart geek like us, we’ll be happy to show you examples of the other eye charts and explain how our equipment works to test your eye acuity for accurate corrective lens prescriptions.


